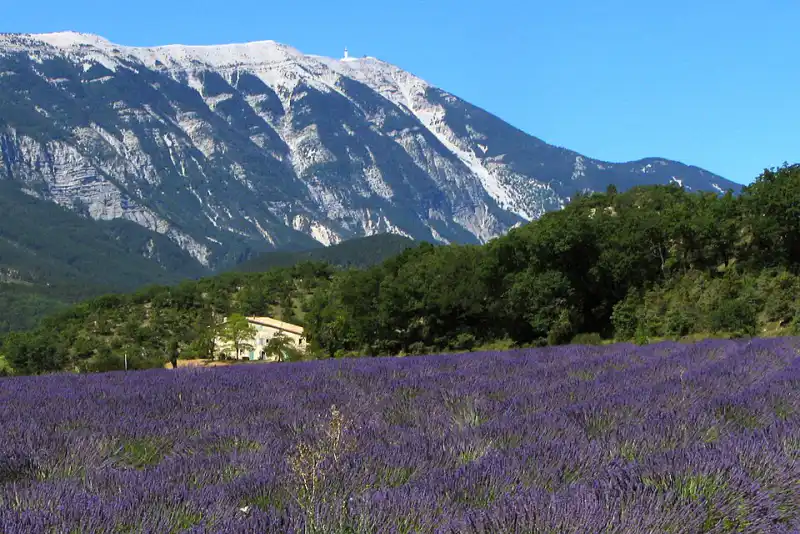
Robert Brink · CC BY-SA 3.0
Scored on our default priorities. Set your own on the map and this report answers those instead.
From the data snapshot of 12 October 2026. The full report opens here with the live data.
Your match
56 today, 53 in 2035#28 of 46
Ahead of most places on healthcare. Behind on cost of living and safety.
By 2035 your match moves from 56 to 53, mostly from climate resilience (86 to 82).
At a glance
- Average temperature
- 12.8°C
- Winters 4.4°C
- Monthly spend
- €1,950
- per person
- Safety
- 76/100
- average 83
- Shortest day
- 8h 54m
- longest 15h 28m
- Air quality
- 12.0 µg/m³
- PM2.5; WHO advises under 5
- Walkability
- 0/100
- 0 shops within 1 km
Today and in 2035
Eight measures, 0 to 100: where each stands, and where it is heading.
Climate Resilience: 86 today, 82 in 2035(Climate model)
The median of 10 climate models (CMIP6, middle-road scenario) is +0.5°C by 2035 and 6 more days above 30°C a year.
Cost of Living: 53 today, 50 in 2035(Our forecast)
Prices here sit below the US level and tend to rise as incomes catch up.
Safety & Stability: 76 today, 76 in 2035(Held at today)
Crime and political stability do not follow a trend we can project, so we hold today's value.
Healthcare Access: 92 today, 92 in 2035(Held at today)
We have no trend for its spending, life expectancy and out-of-pocket mix we can defend yet, so today's value is shown.
Visa Freedom: 47 today, 47 in 2035(Held at today)
Visa rules change by political decision, not by trend, so we hold today's value.
Community Fit: 69 today, 73 in 2035(Our forecast)
The share of residents born abroad has been growing in most countries, and we assume it keeps growing.
Internet Quality: 93 today, 96 in 2035(Our forecast)
The share of people online keeps rising everywhere, fastest where it is lowest.
Tax Friendliness: 44 today, 44 in 2035(Held at today)
Tax law changes by political decision, not by trend, so we hold today's value.
Where it shines
- Strong healthcare. Healthcare Access 92 of 100, against 83 on average across the 85 places we cover.
Worth weighing
- Pricier than most. Cost of Living 53 of 100, against 60 on average across the 85 places we cover.
- Less safe or settled. Safety & Stability 76 of 100, against 83 on average across the 85 places we cover.
Weather and climate
Winters average 4.4°C, and 50 days a year reach 30°C.
- Year-round average
- 12.8°C
- Winter average
- 4.4°C
- coldest three months
- Days of 30°C or more
- 50
- a year
- Humidity
- 70%
- yearly average
- Earthquakes, magnitude 5+
- 0
- within 100 km, 1976–2025
The median of 10 climate models is +0.5°C by 2035 on the middle-road scenario, with 6 more days of 30°C a year. Climate resilience moves from 86 to 82.
Sources: NASA POWER (MERRA-2) (2020–2024) · CMIP6 ensemble via Copernicus CDS (2030–2039 vs 2015–2024) · ND-GAIN Country Index + NASA POWER (MERRA-2) (2024, 2020–2024) · USGS ComCat (1976–2025)
Cost of living
The average person here spends €1,950 a month. A single worker on the average wage keeps €2,759 after tax.
- Monthly spend
- €1,950
- average per person
- Price level
- 108
- EU average = 100
- House prices
- +27%
- over the last ten years
- Can't heat their home
- 11.5%
- of households
- Local income level
- 96%
- of the EU average, this region
- Unemployment
- 7.3%
- Provence-Alpes-Côte d’Azur
Our forecast puts a month at about €2,060 by 2035, in today's money. Prices here sit below the US level and tend to rise as incomes catch up.
Sources: World Bank WDI (2025) · OECD Taxing Wages (2025) · Eurostat prc_ppp_ind (2024) · Eurostat prc_hpi_a (2015→2025) · Eurostat ilc_mdes01 (2025) · Eurostat nama_10r_2gdp (2024) · Eurostat lfst_r_lfu3rt (2025)
Safety and healthcare
Safety scores 76 and healthcare 92, out of 100.
- Homicides
- 1.3
- per 100,000 people a year
- Political stability
- 64/100
- Life expectancy
- 83.8
- years at birth, Provence-Alpes-Côte d’Azur
- Hospital beds
- 6.2
- per 1,000 people, Provence-Alpes-Côte d’Azur
- Health spending
- $6,868
- per person a year (PPP)
- Paid out of pocket
- 9%
- of all health spending
Healthcare is held at 92. We have no trend for its spending, life expectancy and out-of-pocket mix we can defend yet, so today's value is shown. Safety is held at 76: crime and politics follow no trend we can project.
Sources: World Bank WDI (2023) · World Bank WGI (2025) · Eurostat demo_r_mlifexp (2024) · Eurostat hlth_rs_bdsrg2 (2024) · World Bank WDI (2024)
Everyday life
Walkability scores 0 of 100: plan on a car or transit for daily life.
- Walkability
- 0/100
- Within 1 km
- 0
- shops, cafés and services
- Fine dust (PM2.5)
- 12.0
- µg/m³; WHO advises under 5
- Wind
- 3.7 m/s
- yearly average
Sources: OpenStreetMap (Overpass) (2026-10) · CAMS EAC4 via Copernicus ADS (2025) · NASA POWER (MERRA-2) (2020–2024)
Children and schools
Full-time childcare for two small children costs about €550 a month after public support, 14% of an average wage.
- Childcare for two
- €550
- a month after support, national, 2026
- Fees before support
- €912
- a month, two children full-time
- Childcare, share of a wage
- 14%
- of one average wage, after support
- Under-3s in childcare
- 60%
- part- or full-time
Sources: OECD net childcare costs (2026) · Eurostat ilc_caindformal (2025)
Connection and community
13.8% of residents were born abroad, and internet scores 93 of 100.
- People online
- 89%
- Home broadband
- 49
- lines per 100 people
- Born abroad
- 13.8%
- of residents
Our forecast moves internet from 93 to 96 and international community from 69 to 73 by 2035. The share of residents born abroad has been growing in most countries, and we assume it keeps growing.
Sources: World Bank WDI (2024)
Visas and tax
47% of the world's passports can enter without a visa arranged in advance.
- Visa-free entry
- 47%
- of the world's passports
- Tax on an average wage
- 28.0%
- 16.7% income tax + 11.3% social security
- Kept each month
- €2,759
- single, of €3,830 average gross pay
- Kept each month, family
- €3,183
- one earner, two children
- Tax take
- 22.8%
- of the economy (GDP)
- Tax friendliness
- 44/100
Both are held at today's values for 2035: visa and tax rules change by political decision, not by trend.
Sources: Passport Index dataset (current) · World Bank WDI (2024) · OECD Taxing Wages (2025)
Not in this report yet
We would rather say so than guess. Check these before you decide.
- Rents and the price of a square metre
- Residence routes for investors, students and families, and how long each permit takes to get
- Income tax bands, and tax regimes for newcomers
- School fees, and childcare costs in this city rather than the country
- What a family would keep at your own salary
Where every number comes from
- NASA POWER (MERRA-2) 2020–2024
- CMIP6 ensemble via Copernicus CDS 2030–2039 vs 2015–2024
- ND-GAIN Country Index + NASA POWER (MERRA-2) 2024, 2020–2024
- USGS ComCat 1976–2025
- World Bank WDI 2025
- OECD Taxing Wages 2025
- Eurostat prc_ppp_ind 2024
- Eurostat prc_hpi_a 2015→2025
- Eurostat ilc_mdes01 2025
- Eurostat nama_10r_2gdp 2024
- Eurostat lfst_r_lfu3rt 2025
- World Bank WDI 2023
- World Bank WGI 2025
- Eurostat demo_r_mlifexp 2024
- Eurostat hlth_rs_bdsrg2 2024
- World Bank WDI 2024
- OpenStreetMap (Overpass) 2026-10
- CAMS EAC4 via Copernicus ADS 2025
- OECD net childcare costs 2026
- Eurostat ilc_caindformal 2025
- Passport Index dataset current
- World Bank WDI + World Bank WGI 2023, 2025
- Wikidata (local facts, CC0) 2026-10-12
- Nager.Date (public holidays) 2026
- Where Tomorrow forecast (trend rates on the methodology page) October 2026